
📉 What Are the Common Mistakes Traders Make with Technical Indicators?
If you’ve ever used technical indicators like RSI, MACD, or moving averages and still ended up on the wrong side of a trade, you’re not alone. Many traders—especially beginners—misuse technical indicators due to lack of understanding or overreliance. This article breaks down the top mistakes traders make with technical indicators, shows you how to fix them, and provides examples, tables, and easy-to-follow steps so you can start using indicators the right way and make smarter decisions in the market.
🧠 What Are Technical Indicators?
Technical indicators are mathematical formulas based on price, volume, or open interest that help you analyze trends, momentum, volatility, or support/resistance. Popular examples include:
- Moving Averages
- RSI (Relative Strength Index)
- MACD (Moving Average Convergence Divergence)
- Bollinger Bands
While these tools are helpful, they are not magic buttons—and that’s where traders often go wrong.
Table of Contents
👤 Who Commonly Makes These Mistakes?
| Trader Type | Why They Struggle with Indicators |
| Beginners | Overuse too many indicators without understanding |
| Intraday Traders | Rely solely on fast indicators without confirmation |
| Swing Traders | Misinterpret signals as guarantees |
| Overconfident Traders | Ignore market context and fundamentals |
🚫 Top 10 Common Mistakes Traders Make with Technical Indicators
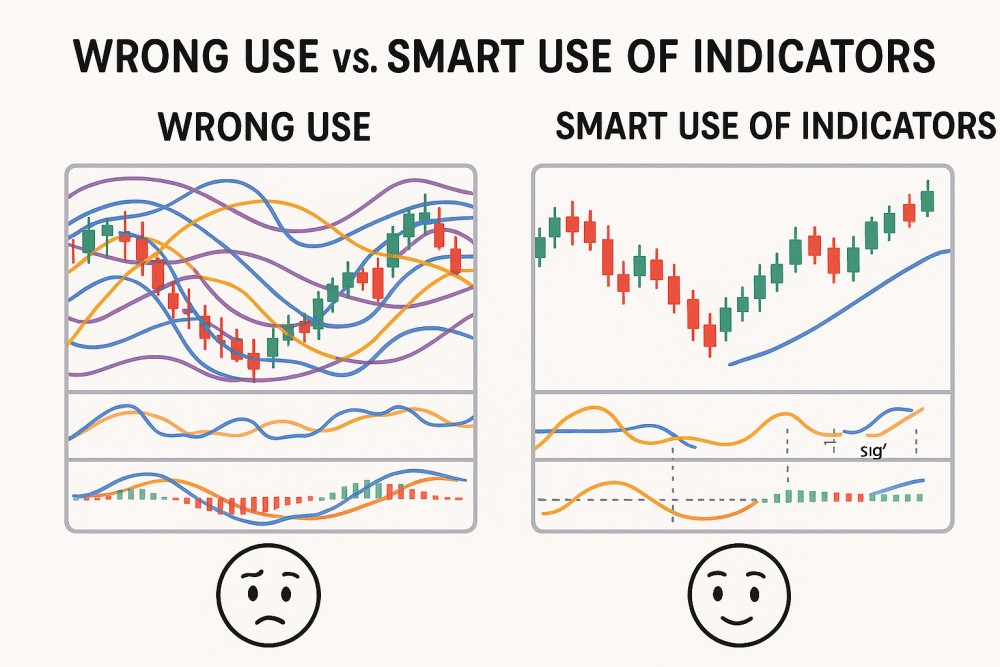
✅ Mistake #1: Using Too Many Indicators at Once
More is not always better.
When you load your chart with 5–10 indicators, you create analysis paralysis. Different tools may give conflicting signals, leading to confusion and hesitation.
Fix: Stick to 2–3 complementary indicators, like RSI + MACD + EMA.
✅ Mistake #2: Ignoring Price Action
Many traders look at indicators but completely ignore what the candlesticks and chart patterns are saying.
Fix: Use indicators to confirm, not replace, price action.
Example: A bullish RSI is meaningless if the stock is making lower lows.
✅ Mistake #3: Blindly Following Buy/Sell Signals
Indicators often give lagging signals. If you act instantly on an RSI “buy” at 30 without checking trend, you may catch a falling knife.
Fix: Combine signals with trend direction and volume analysis.
✅ Mistake #4: Not Customizing Indicator Settings
Default settings may not suit your trading style. For example, the default RSI 14 may lag in fast markets.
Fix: Adjust indicator periods based on your trading timeframe.
| Indicator | Default Setting | Suggested Adjustment |
| RSI | 14 | Use 7–10 for faster signals |
| MACD | 12,26,9 | Use 5,13,5 for swing/intraday |
| EMA | 50,200 | Use 20,50 for short-term trends |
✅ Mistake #5: Ignoring Divergence
Many traders don’t recognize bullish or bearish divergences, which are powerful reversal signals.
Fix: Learn to spot divergence between price and indicator (like RSI or MACD).
Example: Price makes new low, RSI makes higher low = bullish divergence.
✅ Mistake #6: Not Considering Market Conditions
Indicators behave differently in trending vs. ranging markets. RSI may stay overbought in a strong uptrend.
Fix: Understand the market context before trusting signals.
✅ Mistake #7: Using Indicators in Isolation
Relying only on one indicator (e.g., just MACD) without confirmation often leads to false signals.
Fix: Use confluence: two or more indicators + support/resistance + volume.
✅ Mistake #8: Ignoring Volume
Most indicators are price-based. Volume shows market participation, which adds strength to any breakout or signal.
Fix: Always combine volume analysis with indicators.
✅ Mistake #9: Emotional Trading Based on Indicators
Jumping into a trade just because your indicator flashed “buy” is dangerous.
Fix: Stick to a trading plan. Use indicators as one part of your decision-making process.
✅ Mistake #10: Not Backtesting or Practicing
Using indicators live without testing them first is like flying a plane without training.
📊 Table: Correct vs. Wrong Way to Use Indicators
| Mistake | ❌ Wrong Way | ✅ Right Way |
| Indicator Overload | 6+ indicators with no clarity | 2–3 well-chosen tools only |
| RSI at 30 = Blind Buy | Buy immediately | Check trend + divergence first |
| Ignoring Volume | Rely on MACD alone | Add volume confirmation |
| Trading Every Signal | No filtering | Filter with structure and price action |
| Default Settings Misuse | Never change settings | Customize per timeframe |
⚖️ Pros and Cons of Using Technical Indicators
| Pros | Cons |
| Help identify trends and reversals | Can be lagging or misleading in volatile markets |
| Simplify decision-making for beginners | Overuse can lead to confusion and wrong trades |
| Work across different markets and timeframes | Dependence can cause traders to ignore fundamentals |
| Combine well with price action and volume | Not suitable as standalone strategy |
💡 Example Scenario
Imagine you’re analyzing Tata Motors:
- RSI is at 35 (near oversold)
- Price is bouncing from long-term support
- Volume is picking up
- MACD is crossing up
✅ Result: Multiple confirmations = Strong buy signal
But if RSI was 35 and price was making new lows with no volume = ⚠️ Be cautious
✅ Conclusion: Indicators Are Tools, Not Crystal Balls
Technical indicators are incredibly helpful—when used correctly. They are designed to support your trading, not dictate it. Avoid the common traps of overusing tools, ignoring context, or blindly trusting signals. Focus on simplicity, confirmation, and discipline to make better decisions and grow as a confident, smart trader.
🧠 Master the trader’s mindset, not just the tools.
🙋 Frequently Asked Questions (FAQs)
❓ Which indicators are best for beginners?
Start with RSI, MACD, and moving averages. They’re easy to understand and apply.
❓ How many indicators should I use at once?
Use 2–3 max. One trend, one momentum, one confirmation tool is a good mix.
❓ Can indicators work in all market conditions?
Not always. Adjust your tools based on whether the market is trending or ranging.
❓ Should I trust indicator signals alone?
No. Combine them with price structure, volume, and market context.
❓ How can I improve my indicator-based trading?
Practice in demo accounts, backtest your strategy, and focus on continuous learning.
Why Support and Resistance Important-A Safe Trading Decisions (2025 Guide)
How to Identify Breakouts Using Technical Analysis – Full Step-by-Step Guide
Top 7 Technical Indicators for Swing Trading You Must Know [2025 Guide]