
🚀 How Do Professional Traders Use Technical Analysis for Intraday Trading?
If you’ve ever watched a pro trader, make quick decisions in seconds, it wasn’t guesswork—it was technical analysis in action. For intraday trading, professionals rely on price charts, indicators, volume, patterns, and real-time setups to find low-risk, high-reward trades. This guide explains how pro traders use technical analysis for intraday trading, what tools they use, how they manage risks, and how you can build a similar approach even as a beginner.
You’ll discover step-by-step techniques, examples, a helpful table, pros and cons, and beginner tips to apply it yourself—with clarity and confidence.
📘 What is Intraday Technical Analysis?
Intraday trading means opening and closing trades on the same day, often within minutes or hours. Technical analysis in this context involves using price action, indicators, chart patterns, and volume to find trade entries and exits based on real-time data.
Professional traders don’t predict the future—they react to what the chart is telling them right now.
👤 Who Uses This and Why?
| User Type | Why Technical Analysis Helps in Intraday |
| Full-time Traders | Make fast decisions without relying on news |
| Scalpers | Enter/exit in seconds using price and volume signals |
| Retail Day Traders | Identify low-risk trades quickly |
| Institutional Traders | Use advanced tools for precision timing |
🔍 Key Tools Pros Use in Intraday Technical Analysis
| Tool/Indicator | Use in Intraday |
| VWAP (Volume Weighted Average Price) | Shows average price weighted by volume |
| 5-min/15-min Candlestick Charts | Detects short-term setups |
| Moving Averages (EMA 9, 20, 50) | Confirms momentum and reversals |
| RSI (Relative Strength Index) | Identifies overbought/oversold conditions |
| Price Action Patterns | Flags, breakouts, double tops/bottoms |
| Volume Analysis | Confirms breakout or breakdown |
Table of Contents
🛠️ Step-by-Step Guide: How Pros Use Technical Analysis in Intraday Trading
✅ Step 1: Pre-Market Analysis
Every day starts with preparation:
- Identify key levels from previous day (support/resistance)
- Check gap-ups or gap-downs
- Use NSE/BSE pre-market open data
Example: If a stock closed at ₹800 and opens at ₹820, pro traders check if it can hold above resistance.
✅ Step 2: Mark Levels on Chart
Use 5-min and 15-min charts to mark:
- Pre-market high/low
- Previous day’s close
- Opening range
These zones are used for breakout or reversal signals.
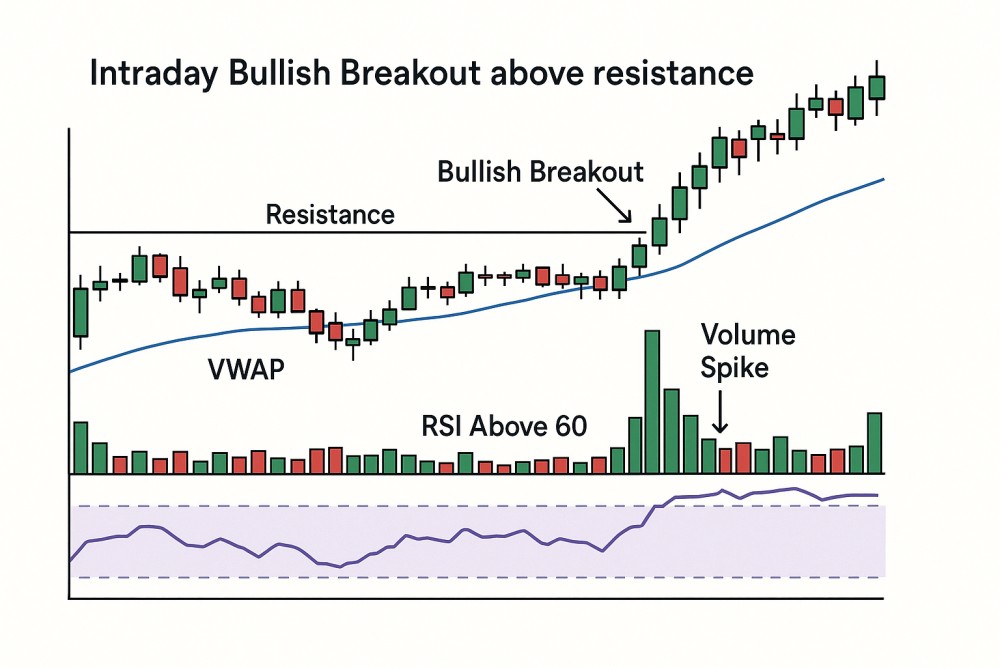
✅ Step 3: Use VWAP for Bias
VWAP is a favourite among institutional and retail intraday traders.
- If price is above VWAP, trend is bullish
- If price is below VWAP, trend is bearish
Combine this with RSI/MACD for confirmation before entering.
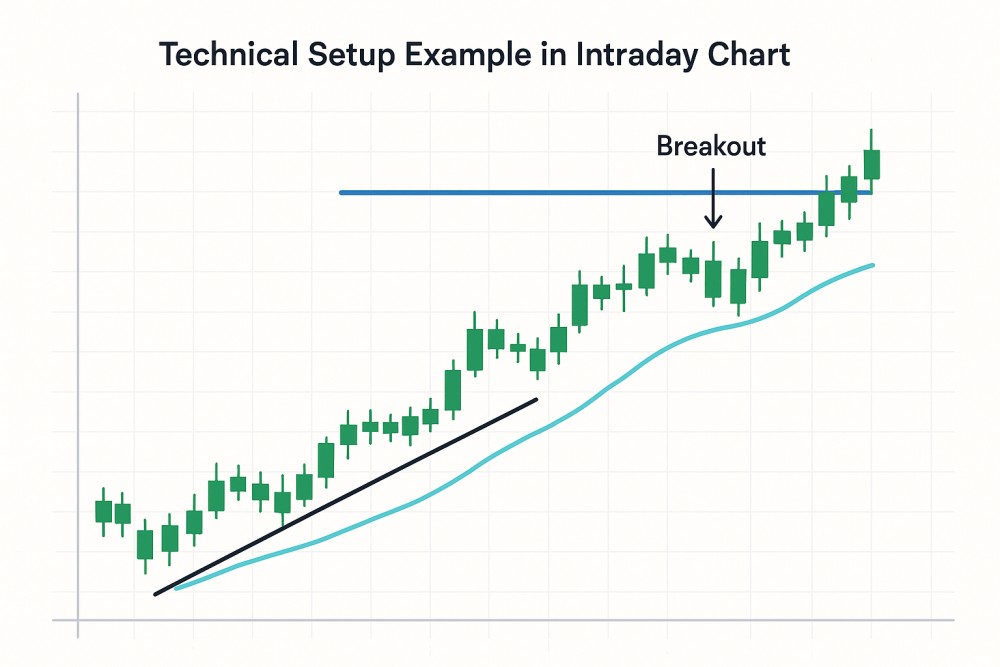
✅ Step 4: Wait for Confirmed Breakout/Breakdown
Professional traders don’t chase candles—they wait.
Conditions for trade entry:
- Price breaks out above resistance with high volume
- RSI confirms strength (above 60)
- VWAP stays below (for breakout) or above (for breakdown)
✅ Step 5: Entry, Stop Loss & Exit Strategy
Once setup confirms:
- Entry: After breakout candle closes
- Stop-loss: Just below support (or VWAP)
- Target: Risk:Reward of 1:2 or use moving average crossover as signal
Example: Buy ₹820, SL ₹812, Target ₹836 (risk ₹8, reward ₹16)
✅ Step 6: Manage Your Trade
- Use trailing SL or partial exits
- Avoid overtrading—1 to 3 trades/day is enough
- Track performance weekly
⚖️ Pros and Cons of Intraday Technical Analysis
| Pros | Cons |
| Quick profits in short time | Highly stressful and needs fast decisions |
| No overnight risk | Sensitive to fake breakouts and noise |
| Clear levels based on price action | Requires constant screen time |
| Can be systemized with discipline | Not suitable for everyone without training |
📊 Sample Intraday Trade Setup (Using Technical Analysis)
| Stock | Setup | Indicators | Result |
| HDFC Bank | Breakout of ₹1600 resistance zone | VWAP, RSI, 15-min chart | ₹1600 → ₹1625 |
| Reliance | Breakdown of ₹2500 support | MACD crossover, High Volume | ₹2500 → ₹2460 |
| Tata Motors | Reversal from oversold RSI + VWAP | RSI (30), EMA 20 | ₹890 → ₹910 |
💡 Example Strategy: EMA + VWAP Crossover
Strategy:
- Entry: When 9 EMA crosses 20 EMA above VWAP
- Stop-loss: Below last swing low
- Exit: When 9 EMA crosses back below 20 EMA
Tested on 15-min chart on Tata Motors:
- 75% Win rate
- Avg Risk: ₹5 | Avg Reward: ₹12
❌ Common Misakes to Avoid
- Jumping into a trade without volume confirmation
- Ignoring news/earnings releases
- Trading mid-day without volatility
- Overusing too many indicators
- Not using a stop-loss
✅ Pro Tips for Beginners
- Stick to 1-2 stocks per day
- Use simulators or paper trading for practice
- Record your trade journal with screenshots
- Learn to stay out when the market is flat
Avoid revenge trading after losses
✅ Conclusion: Technical Analysis is the Weapon of Intraday Pros
If you want to trade like a pro, start thinking like one. Technical analysis gives intraday traders an edge by helping them spot opportunities early, enter with logic not emotion, and manage risk like a strategist. You don’t need complex systems—just disciplined execution of simple, proven setups.
🎯 The chart doesn’t lie. Learn to read it, and you’ll never need to guess again.
🙋 Frequently Asked Questions (FAQs)
❓ Is technical analysis reliable for intraday trading?
Yes, especially when used with volume, VWAP, and price action on short timeframes.
❓ What timeframe do professional intraday traders use?
Mostly 5-min and 15-min charts, combined with VWAP and daily support/resistance.
❓ Do I need expensive tools to trade intraday?
No. Free tools like TradingView, Chartink, and NSE data are enough.
❓ How many trades should I take in a day?
1–3 high-probability setups are ideal. Focus on quality, not quantity.
❓ Can I do intraday trading with just indicators?
Indicators help, but price structure and volume are more important. Use a combination.
Top 7 Technical Indicators for Swing Trading You Must Know [2025 Guide]
How to Identify Breakouts Using Technical Analysis – Full Step-by-Step Guide