
🔄 Top Technical Indicators That Accurately Predict Market Reversals
When you’re trading or investing, few moments are as powerful—and profitable—as correctly catching a market reversal. Imagine spotting a falling stock just before it starts to rise, or exiting a position at the top before a crash. That’s the power of technical indicators that signal market reversals. This guide helps you understand which indicators are most accurate, how to use them step-by-step, and how to combine them for real-world success—whether you’re a beginner or experienced trader.
By the end, you’ll know exactly which indicators to trust, how to read them, and how to apply them to avoid false signals and improve your win rate.
Table of Contents
🧭 What Is a Market Reversal?
A market reversal occurs when a trend changes direction—either from uptrend to downtrend or vice versa. Spotting this moment can help you:
- Enter at the bottom
- Exit at the top
- Avoid big losses
- Maximize profits
👥 Who Needs Reversal Indicators?
| Trader Type | Why They Use Reversal Signals |
| Swing Traders | To enter trades near the bottom/top |
| Options Traders | To pick direction-sensitive positions (Calls/Puts) |
| Intraday Traders | For fast reversals on small timeframes |
| Long-term Investors | To protect against major corrections or crashes |
📌 Top Technical Indicators That Predict Reversals Accurately
Let’s break down the most reliable reversal indicators, including what they show, when to use them, and how.
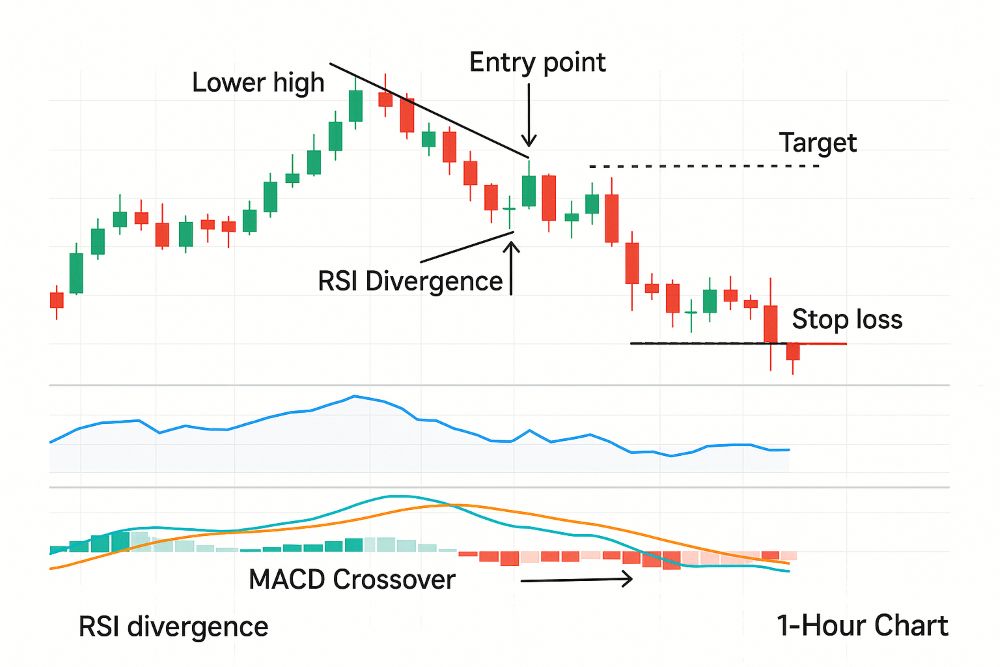
📉 1. Relative Strength Index (RSI)
How it works: RSI measures momentum.
- RSI < 30 = Oversold → Possible upward reversal
- RSI > 70 = Overbought → Possible downward reversal
Best on: Daily, 1-hour timeframes
Use with: Divergence for accuracy
Example: If RSI is making higher lows but the price is falling, that’s bullish divergence, signalling a bottom.
📊 2. Moving Average Convergence Divergence (MACD)
How it works: Tracks momentum shifts.
- When MACD line crosses above Signal line = Bullish
- When it crosses below = Bearish
Use it on: 15-min to daily charts
Best for: Confirming trend change with momentum
Combine with RSI or trendline breaks for stronger confirmation.
🔁 3. Bollinger Bands
How it works: Measures volatility.
- Price hitting lower band + bullish candle = Possible bottom
- Price touching upper band + bearish candle = Possible top
Use with: RSI for stronger signals
🔃 4. Volume + Price Patterns
How it works: Watch for reversal patterns with volume spike:
- Hammer
- Doji
- Engulfing
- Double Bottom/Top
Important: Volume should rise during reversal.
⚡ 5. Stochastic Oscillator
How it works: Like RSI but faster.
- Below 20 = Oversold
- Above 80 = Overbought
- Look for crossovers inside these zones
Good for: Short-term trades or scalping
📋 Table: Best Reversal Indicators at a Glance
| Indicator | What It Predicts | Best Use Case | Timeframe |
| RSI | Overbought/Oversold | Momentum reversal | 1-hr, daily |
| MACD | Trend shift | Confirmation of direction | 15-min, 1-hr |
| Bollinger Bands | Volatility + reversal | Range and breakout trades | Daily, 4-hr |
| Stochastic Oscillator | Quick momentum changes | Fast entries/exits | 5-min, 15-min |
| Volume Patterns | Breakout or rejection zone | Entry/exit with volume spikes | All timeframes |
✅ Step-by-Step Guide: Using Reversal Indicators the Right Way
🔍 Step 1: Identify Overbought or Oversold Zone
Open RSI or Stochastic:
- Is RSI < 30? Look for bullish candles.
- Is RSI > 70? Look for bearish signs.
🔁 Step 2: Check for Divergence
Compare indicator vs price:
- Price making lower low + indicator higher low = Bullish divergence
- Price making higher high + indicator lower high = Bearish divergence
🔄 Step 3: Add Confirmation
Use MACD crossover, or:
- Reversal candlestick (Hammer, Engulfing)
- Bollinger band bounce
- Volume spike at reversal point
🛑 Step 4: Set Stop Loss & Target
- SL: Below swing low (for long) or above high (for short)
- Target: Risk:Reward of at least 1:2
⚖️ Pros and Cons of Using Reversal Indicators
| Pros | Cons |
| Helps you catch major trend changes | Can give false signals in sideways markets |
| Reduces emotional decisions | Lagging indicators may react after reversal begins |
| Improves reward-to-risk ratio | Needs confirmation to avoid fake outs |
| Easy to learn and apply with basic charting tools | Requires patience and back testing |
💡 Example Scenario
Stock: Tata Motors
- RSI = 26 on daily chart
- Price forms a hammer near previous support
- MACD crossover happens the next day
Trade Setup: Buy Call Option (1-week expiry)
Entry: ₹890 | SL: ₹878 | Target: ₹915
Outcome: Target hit in 2 sessions
✅ Conclusion: Reversal Indicators Can Sharpen Your Trading Edge
In fast-moving markets, timing is everything. Technical indicators like RSI, MACD, and Bollinger Bands offer you a reliable, visual way to spot when trends are about to reverse. While no tool is 100% perfect, combining a few well-tested signals with chart patterns and volume confirmation can drastically improve your success rate.
🎯 The best traders aren’t the fastest—they’re the most prepared. Use reversal indicators to enter before the crowd.
🙋 Frequently Asked Questions (FAQs)
❓ Can indicators alone predict reversals accurately?
No single indicator is perfect. Use 2–3 in combination with price action and volume for better results.
❓ What’s the best timeframe for spotting reversals?
1-hour or daily charts work best for higher accuracy, while 5-min/15-min charts are for short-term trades.
❓ Should beginners use these indicators?
Yes, indicators like RSI and MACD are beginner-friendly and widely available on free charting platforms like Trading View.
❓ Do indicators repaint or change after forming?
Most don’t repaint, but they may lag—so always use confirmation before entering a trade.
❓ Are there tools to scan for reversals?
Yes. Use scanners on platforms like Chartink, Trading View, or Trend Spider to find setups automatically.
How to Back test Technical Analysis Strategies for Stocks Effectively – Full Beginner’s Guide