
📊 How to Integrate Fundamental Analysis with Technical Analysis?
If you’ve ever felt confused about whether to rely on earnings reports or candlestick charts, you’re not alone. Many traders and investors face this dilemma. The truth is, you don’t have to choose one over the other. By FA + TA combo , you can make better, well-informed decisions—maximizing profits while minimizing risk. This article shows you exactly how to integrate both methods, when to apply them, who benefits the most, and how to build a strong strategy step-by-step.
Whether you’re a beginner or experienced trader, learning how to blend fundamentals with charts can give you a serious edge.
🧠 What’s the Difference Between Fundamental and Technical Analysis?
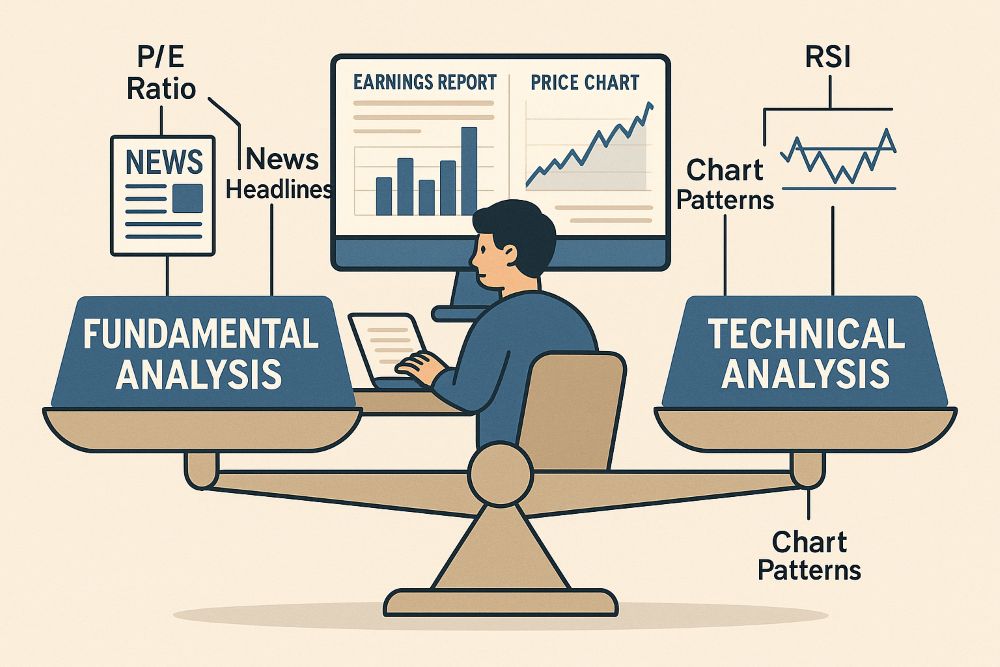
| Aspect | Fundamental Analysis (FA) | Technical Analysis (TA) |
| Focus | Company health, economy, earnings, valuation | Price charts, volume, indicators, patterns |
| Timeframe | Long-term | Short to medium-term |
| Tools Used | P/E ratio, EPS, ROE, balance sheet | RSI, MACD, candlesticks, support/resistance |
| Best For | Investors | Traders |
Table of Contents
👥 Who Should Combine Both?
| You are a… | Why Combine FA + TA |
| Long-term investor | Identify fundamentally strong stocks with ideal buy zones |
| Swing trader | Pick strong companies and time your entry better |
| Option trader | Use FA for direction bias and TA for entry/exit timing |
| Value investor | Avoid value traps by checking chart structure |
🛠️ Step-by-Step Guide: How to Integrate Fundamental and Technical Analysis
Let’s walk through the process of combining both types of analysis like a pro.
✅ Step 1: Start with Fundamental Analysis (Long-Term Health)
Before buying any stock or asset, ask:
- Is the company growing?
- Are revenues, profits, and margins improving?
- Is the debt under control?
- Are valuations attractive?
Use sources like:
Example: TCS shows consistent revenue growth, high ROE, low debt, and strong cash flow = fundamentally sound.
✅ Step 2: Identify Technical Setups (Right Time to Enter)
Once you’ve shortlisted fundamentally good stocks:
- Open the chart (TradingView, Investing.com)
- Look for:
- Breakouts from resistance
- RSI near 30 (oversold)
- Bullish candlestick patterns
- Volume confirmation
Example: TCS forms a double bottom pattern near a strong support zone with increasing volume = technical entry point.
✅ Step 3: Combine Both for Confirmation
| Signal | Interpretation |
| Strong fundamentals + bullish chart | Great buy opportunity |
| Strong fundamentals + weak chart | Wait or accumulate gradually |
| Weak fundamentals + strong chart | Risky; avoid unless purely technical play |
✅ Step 4: Entry, Exit, and Risk Management
- Entry: Based on chart pattern or indicator signal
- Stop-loss: Below technical support
- Target: Based on valuation or prior resistance
Use FA for “what” to buy and TA for “when” to buy.
🔁 Example: Integrating FA + TA in Real Life
Stock: Infosys Ltd
- Fundamental Insight: Net profit up 12%, zero debt, strong cash flows
- Technical Insight: RSI at 35, bouncing off 200-DMA
- Action: Buy near ₹1400 with SL at ₹1360, Target ₹1520
- Outcome: 8% profit in 2 weeks
⚖️ Pros and Cons of Combining Both Analyses
| Pros | Cons |
| More holistic view of the stock | Takes more time to analyze both sets of data |
| Avoids buying bad stocks on technical breakout | Requires learning two different methods |
| Helps avoid timing mistakes in value investing | May give conflicting signals in short-term scenarios |
| Improves decision-making confidence | Can overwhelm beginners without a clear process |
📌 When to Use Which?
| Scenario | Best Tool to Use |
| Choosing sectors/stocks | Fundamental analysis |
| Entry/exit within a month | Technical analysis |
| Identifying long-term multibaggers | Fundamental first, then TA |
| High-volatility market | Technical setups with FA backing |
💡 Tips to Get Started (Especially for Beginners)
- Start with 1–2 fundamental metrics like ROE and EPS growth
- Use basic TA tools like RSI, moving averages, and support/resistance
- Avoid buying solely based on news or breakout without checking fundamentals
- Maintain a watchlist of good companies and enter during technical dips
- Don’t overcomplicate—simple, repeated systems work best
✅ Conclusion: Use Both for Maximum Edge
In the ever-changing stock market, you don’t have to pick sides. By combining fundamental analysis to find strong stocks and technical analysis to time your entries, you gain an edge that many traders overlook. You’ll reduce risk, increase reward potential, and make more informed decisions—something that can transform your trading journey from stressful to strategic.
🎯 Smart traders use every tool available. Let fundamentals tell you “What” and technical tell you “When.”
🙋 Frequently Asked Questions (FAQs)
❓ Is it necessary to learn both analyses?
Yes, especially if you’re serious about long-term success. You don’t need to be an expert in both, but understanding the basics of each adds huge value.
❓ Can I rely only on technical analysis?
You can—but it’s riskier. If you’re holding positions beyond a few days, ignoring fundamentals can lead to bad picks.
❓ What if the chart is bullish but fundamentals are poor?
It’s a red flag. Either skip the trade or keep it strictly short-term with tight risk controls.
❓ Which platform provides both FA and TA data?
Use TradingView for technicals and Screener.in or Moneycontrol for fundamentals.
❓ How much time should I spend on analysis?
Start with 15–30 minutes daily. Build a checklist to speed up your research process.