
🚀 How to Identify Breakout Using Technical Analysis? [Beginner’s Guide with Examples]
Have you ever seen a stock or index suddenly surge past a resistance level—and then keep flying higher? That’s the power of a breakout. But spotting a real breakout vs. a fake one is the real game-changer. In this guide, you’ll learn exactly how to identify breakouts using technical analysis, what tools to use, who can benefit, and why volume is your best friend. We’ll walk through clear examples, a step-by-step approach, pros and cons, and how to protect yourself from traps—all in beginner-friendly language.
📘 What is a Breakout in Technical Analysis?
A breakout happens when price moves above a resistance level (bullish breakout) or below a support level (bearish breakout) with momentum.
Example: If Nifty breaks above 22,000, which had held for weeks, that’s a bullish breakout.
Why it matters: Breakouts often lead to strong price trends. But not all breakouts succeed.
Table of Contents
👤 Who Should Learn Breakout Trading?
| Trader Type | Why Breakout Analysis Helps |
| Beginners | Learn structured entries with proper stop-loss |
| Swing Traders | Catch big moves early after consolidation |
| Day Traders | Spot high-volume breakout zones |
| Long-Term Investors | Time entries after key levels are cleared |
🔍 Why Breakout Identification Is So Important
When you spot a real breakout:
- You catch the early stage of a trend
- Enter with high reward-to-risk ratios
- Avoid buying into fake rallies or breakdown traps
It improves your overall accuracy and decision-making in volatile markets.
📊 Key Components to Spot a Valid Breakout
| Element | What to Look For |
| Volume | Must be higher than average during breakout |
| Candle Strength | Wide candle body; close above/below breakout level |
| Consolidation Before Breakout | Price should coil before breaking |
| Retest of Level | Price may retest broken level before rallying |
| No Immediate Rejection | Avoid entries with sharp pullbacks post breakout |
🛠️ Step-by-Step Guide: How to Identify a Breakout
✅ Step 1: Spot a Strong Support or Resistance Zone
Use a daily or hourly chart. Look for levels where price:
- Frequently reversed in the past
- Had trouble breaking through multiple times
Example: Stock repeatedly failing to cross ₹1000 = Strong resistance.
✅ Step 2: Wait for Price to Approach the Zone
As price nears the level again:
- Watch for tighter candles (indicates indecision)
- Volume should be slightly increasing
This shows price coiling, which is typical before a breakout.
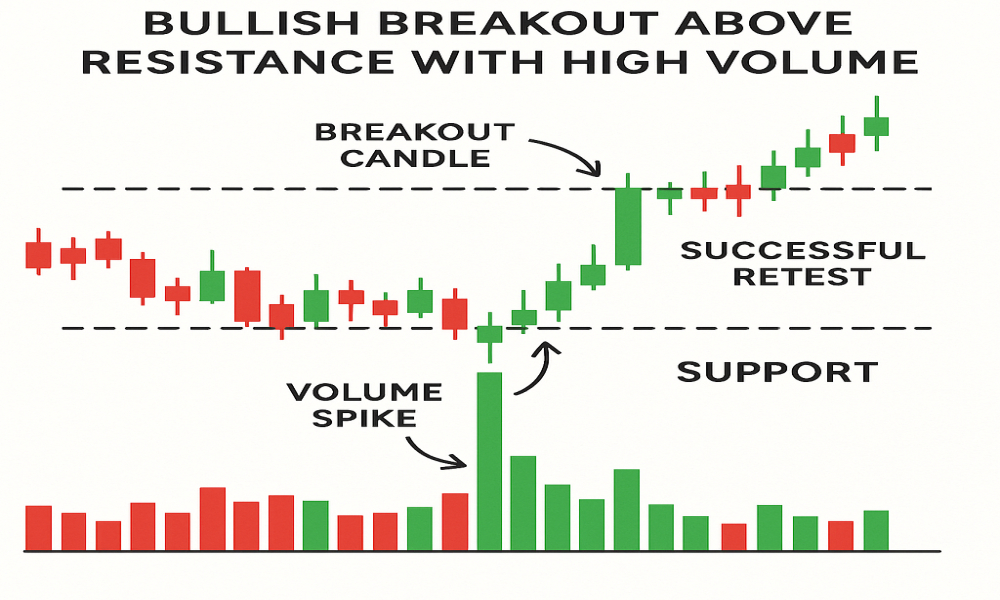
✅ Step 3: Watch for a High-Volume Candle Break
The breakout candle must:
- Have strong volume (1.5x to 3x average)
- Close above resistance (or below support)
- Be decisive (not a doji or long-wick candle)
✅ Valid Breakout: Clean close above ₹1000 with high volume
❌ Fake Breakout: Price touched ₹1005, then fell back to ₹990 same day
✅ Step 4: Look for Retest or Follow-Through
Price may come back to test the breakout zone. Don’t panic.
- Retest + bounce = strong confirmation
- No retest + strong follow-through = also valid
Set alert at breakout level and watch for price behavior.
✅ Step 5: Set Stop Loss and Target
- Stop-loss: Just below breakout level or last swing low
- Target: Measure height of previous range and project it forward
Example: Range = ₹950–₹1000 → Target after breakout = ₹1050
💡 Breakout Tools You Can Use
| Tool/Indicator | Purpose |
| Volume Bars | Confirm breakout strength |
| Bollinger Bands | Price expansion after squeeze |
| Moving Averages (20/50 EMA) | Slope confirms trend direction |
| RSI | Must not be extremely overbought at breakout |
| Trendlines/Chart Patterns | Confirm breakout from flags, triangles etc. |
⚖️ Pros and Cons of Breakout Trading
| Pros | Cons |
| Catch early trends with strong momentum | False breakouts happen often |
| Works on all timeframes | Needs fast decision-making in live market |
| Defined entry, stop-loss, and target | Overreliance can lead to overtrading |
| High reward-to-risk setups | Breakouts can reverse without warning |
📈 Real-Life Example: Breakout on Bank Nifty
- Resistance: 49,200
- Breakout: Price breaks and closes at 49,500 with 3x volume
- Retest: Next day, it dips to 49,250, bounces with volume
- Target: Moved to 50,500 in 4 days
✅ Classic breakout with volume and retest confirmation.
✅ Conclusion: Breakouts Are Opportunities — But Only If You Confirm Them
Breakouts offer some of the most powerful setups in trading, but only when confirmed with volume and structure. As a beginner, your focus should be on identifying the level, waiting for strong confirmation, and avoiding emotional entries. Use the right tools, trust your setup, and don’t chase every candle. The market rewards patience and discipline.
🧠 The breakout is not just the price—it’s the story behind the move.
🙋 Frequently Asked Questions (FAQs)
❓ What is a breakout in technical analysis?
It’s when price moves beyond a support or resistance level with volume and momentum.
❓ How can I avoid false breakouts?
Wait for strong volume, a clean close above the level, and ideally a retest.
❓ Do breakouts work in all timeframes?
Yes, but reliability improves on higher timeframes like daily or 4H charts.
❓ Should I buy as soon as the price crosses resistance?
No. Wait for confirmation: a full candle close, high volume, or retest.
❓ Are breakout strategies suitable for beginners?
Yes. They offer clear rules for entry, stop-loss, and targets—great for learning discipline.
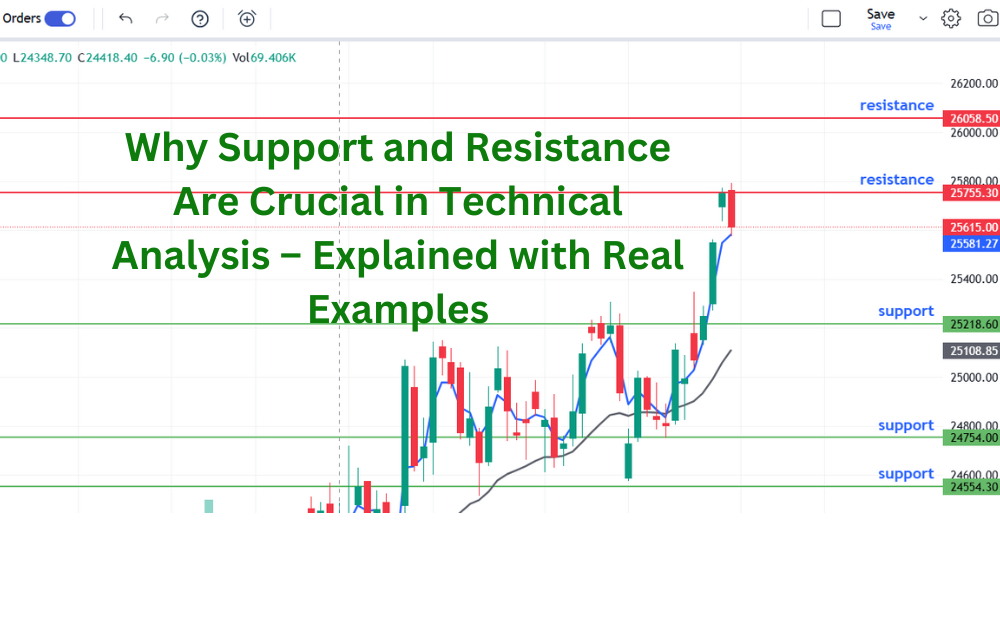
Why Support and Resistance Are Crucial in Technical Analysis – Explained with Real Examples