
📊 How Can I Backtest Technical Analysis Strategies for Stocks Effectively?
If you’re serious about improving your trading results, you can’t skip backtesting. Backtesting is the process of applying your technical analysis strategy to past stock data to see how it would have performed. Whether you’re a beginner trying out a simple moving average crossover or a seasoned trader refining your RSI strategy, backtesting helps you learn what works before risking real money. In this guide, you’ll learn what backtesting is, why it’s important, how to do it step-by-step, who benefits, tools to use, examples, and tips to avoid common mistakes.
📘 What is Back testing in Technical Analysis?
Backtesting means applying your trading strategy to historical stock price data to evaluate its effectiveness.
If a moving average crossover strategy worked well over the past five years on Reliance Industries, it might work again—if market conditions are similar.
Table of Contents
👤 Who Should BackTest Technical Strategies?
| Trader Type | Why Back testing Helps Them |
| Beginners | Understand how strategies work before live trading |
| Swing Traders | Test profitability of setups over weeks/months |
| Day Traders | Refine intraday entries using fast charts |
| Algo Traders | Validate automated systems |
🧠 Why is Backtesting So Important?
- Saves you from trial-and-error in live markets
- Builds confidence in your system
- Helps you measure risk/reward before execution
- Detects flaws in your strategy early
Would you drive a new car without testing the brakes? Backtesting is that test drive for your trading strategy.
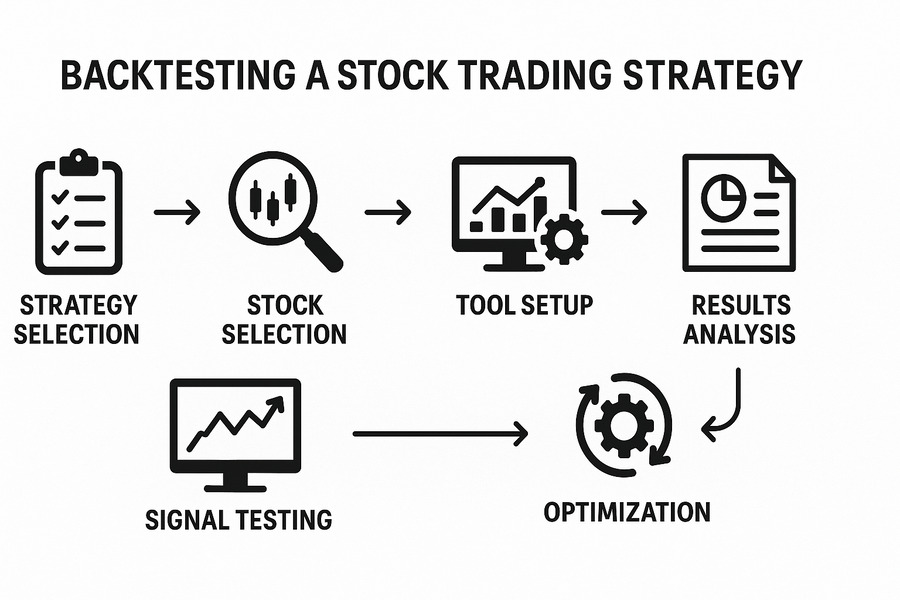
🛠️ Step-by-Step Guide: How to Backtest Technical Analysis Strategies
✅ Step 1: Choose a Trading Strategy to Test
Pick a clear and rule-based strategy. Avoid vague setups. Example Strategy: Buy when 50-day EMA crosses above 200-day EMA + RSI below 60.
✅ Step 2: Select the Right Stock and Timeframe
Backtest on the same stock type and timeframe you intend to trade.
| Stock Type | Suggested Timeframe |
| Large-cap stocks | Daily or weekly |
| Intraday stocks | 5-min / 15-min charts |
| Swing stocks | 1-hour or daily |
✅ Step 3: Use a Backtesting Platform
Here are some popular tools you can use:
| Tool Name | Best For | Link |
| Trading View | Manual + script backtesting | tradingview.com |
| Chart ink | Scanning + manual testing | chartink.com |
| Stocktakes | Free basic backtests (India) | stockbacktest.com |
| Ami broker | Advanced automated backtests | amibroker.com |
✅ Step 4: Apply Your Strategy to Historical Data
Use historical price data from the last 2–5 years. For each signal:
- Note the entry date and price
- Define stop-loss and target
- Track exit price and outcome
You can use an Excel sheet to record and analyse all trades manually.
✅ Step 5: Evaluate the Results
Calculate key metrics:
Maximum Drawdown
Win Rate (No. of Wins ÷ Total Trades)
Average Profit/Loss
Risk-to-Reward Ratio
✅ Step 6: Refine the Strategy Based on Results
If it worked well—great. If not:
- Tweak indicators (change periods)
- Adjust entry/exit rules
- Add filters like volume or volatility
Then backtest again with the new settings.
📊 Example: Backtesting a Simple RSI Strategy
Strategy:
- Buy when RSI < 30
- Sell when RSI > 70
- Use on daily chart of Infosys
Backtest Result (2020–2024):
| Metric | Value |
| Total Trades | 22 |
| Winning Trades | 14 |
| Win Rate | 63.6% |
| Avg Profit per Trade | ₹4500 |
| Max Drawdown | ₹9000 |
| Risk/Reward Ratio | 1:2.5 |
⚖️ Pros and Cons of Backtesting
| Pros | Cons |
| Tests strategy risk-free | Past performance ≠ future results |
| Identifies flaws before risking real money | Overfitting can create unrealistic confidence |
| Builds discipline and confidence | Manual backtesting can be time-consuming |
| Helps set realistic return expectations | Requires clean historical data |
⚠️ Common Mistakes in Backtesting
❌ Overfitting
Making a strategy so perfect on past data that it fails in real markets.
Fix: Use forward testing or out-of-sample data.
❌ Ignoring Transaction Costs
Ignoring brokerage, slippage, and taxes gives false profitability.
Fix: Include realistic costs per trade in calculations.
❌ Using Incomplete Data
Backtesting on only one year or during a bull market can be misleading.Fix: Use multi-year data across different market cycles.
💡 Bonus Tip: Forward Test After Backtest
Before going live:
- Trade your back tested strategy in a paper trading account for 1–2 months
- If results match your back test → you’re ready
Use platforms like Trading View Paper Trading for simulation
✅ Conclusion: Backtesting is the Foundation of Smart Trading
Backtesting is not just a good practice—it’s essential if you want to be a consistent trader. When you back test a strategy, you turn emotion into logic, guesses into calculations, and mistakes into learning. If you’re just starting, keep it simple. Start with one stock, one setup, and test it thoroughly before going live.
🎯 In trading, confidence comes from tested results—not from hope.
🙋 Frequently Asked Questions (FAQs)
❓ What is the best platform to back test strategies?
Trading View is great for both beginners and advanced traders due to its scripting tools and charting ease.
❓ Can I back test without coding?
Yes. Platforms like Chartink and manual Excel tracking allow no-code back testing.
❓ How long should I back test a strategy?
Ideally, at least 2–5 years of data or across different market phases.
❓ Is back testing 100% reliable?
No. Past performance doesn’t guarantee future success. It helps you reduce risk, not eliminate it.
❓ How do I know if a strategy is worth trading live?
It should show consistent results, high risk-to-reward, and perform well in forward testing or paper trading.
Why Support and Resistance Important-A Safe Trading Decisions (2025 Guide)