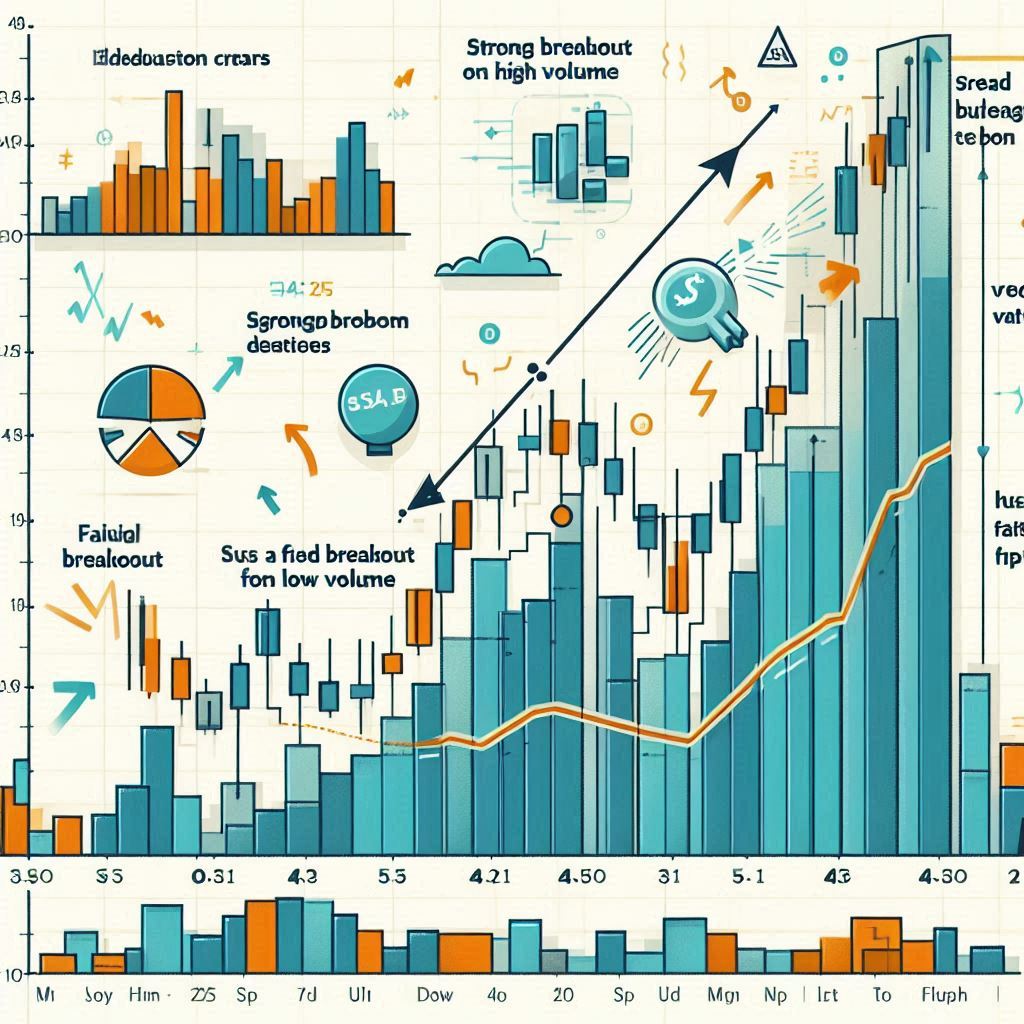
📊 What is the Role of Volume in Technical Analysis in Index Trading?
When you trade indices like Nifty, Sensex, or S&P 500, it’s easy to focus only on price charts. But here’s the thing: price without volume tells only half the story. Volume plays a critical role in technical analysis, especially in index trading, where market psychology drives large movements. In this article, you’ll discover how volume confirms trends, who should use it, and why it improves your entry and exit timing. You’ll also get a step-by-step guide, real-world examples, a table of volume-based tools, and a breakdown of the pros and cons to help you use volume effectively—even if you’re a beginner.
Table of Contents
📌 What is Volume in Index Trading?
Volume represents the number of contracts or shares traded during a specific period. volume in index trading, shows how many traders or institutions are participating in a move.
Example: If Nifty 50 rises 200 points on low volume, it might not be a strong rally. But if it rises the same amount on high volume, the move has conviction.
👤 Who Should Use Volume Analysis in Index Trading?
| Trader Type | Why Volume Helps Them |
| Beginners | Confirms if a trend is real or fake |
| Swing Traders | Identifies breakout strength |
| Day Traders | Helps time intraday entries and exits |
| Institutional Traders | Detect large orders behind price moves |
Whether you’re just starting or managing a large portfolio, volume gives insights into market strength you won’t see from price alone.
🔍 How Volume Works in Technical Analysis?
Volume acts as a confirmation tool. It answers the question: Is this price move strong or weak? Here’s how:
- High volume = conviction (more participation)
- Low volume = indecision or lack of interest
You should analyze volume along with price patterns like breakouts, reversals, and consolidation phases.
🛠️ Step-by-Step Guide: Using Volume in Index Trading
Let’s walk through a practical way to apply volume to your trading.
✅ Step 1: Understand Basic Volume Principles
- A price rise on increasing volume = bullish signal
- A price rise on decreasing volume = weak or false move
- A price drop on increasing volume = strong bearish signal
- A breakout with low volume = likely to fail
✅ Step 2: Use Volume Indicators
You don’t have to guess. These volume-based tools simplify your analysis.
| Volume Tool | Purpose | Best Used For |
| Volume Bars | Raw volume per candle | Every chart |
| On-Balance Volume (OBV) | Tracks volume flow with price | Trend confirmation |
| Volume Weighted Average Price (VWAP) | Institutional buying/selling reference | Intraday/short-term trading |
| Accumulation/Distribution Line | Measures strength of buying/selling pressure | Breakout and trend analysis |
✅ Step 3: Confirm Breakouts with Volume
Breakout without volume = trap.
When an index like Nifty breaks a resistance level, always check if volume is above average.
Example: If Nifty breaks 23,000 with 2x average volume, the move is more reliable than a low-volume breakout.
✅ Step 4: Detect Reversals with Volume Divergence
- Price making new highs, but volume falling = bearish divergence
- Price making new lows, but volume falling = bullish divergence
These signals often precede major reversals.
📌 Real-World Example: Nifty Index Volume Confirmation
Let’s say Nifty is forming a bullish flag pattern.
You wait for a breakout at 22,500. When it happens, you check volume.
- If volume is 3x the average of the last 10 days → ✅ Strong breakout
- If volume is lower than average → 🚫 Risky, avoid trade
⚖️ Pros and Cons of Volume in Index Trading
| Pros | Cons |
| Confirms price patterns like breakouts and reversals | Volume data can vary across platforms |
| Highlights institutional activity | May give delayed confirmation in fast markets |
| Works well with any timeframe (daily, hourly, intraday) | Volume spikes can be misleading due to one-time trades |
| Improves risk management and trade confidence | Needs context; not effective when used in isolation |
🧠 Beginner’s Tip: Don’t Use Volume Alone
Volume is a support tool, not a standalone strategy. Combine it with:
- Support/Resistance zones
- Candlestick patterns
- Indicators like RSI or MACD
✅ Conclusion: Is Volume Analysis Valuable in Index Trading?
Absolutely. Volume is a key piece of technical analysis that helps you validate price moves, confirm trends, and avoid false breakouts. In index trading, where price can be driven by institutions and macro sentiment, volume shows whether the big money is buying in or staying out. When you combine volume with good chart patterns, it becomes a powerful tool in your trading toolbox.
🧭 You don’t need to be perfect—just more informed than the average trader.

🙋 Frequently Asked Questions (FAQs)
❓ Why is volume important in index trading?
Volume confirms the strength behind price moves. High volume means high conviction.
❓ What’s the best volume indicator for index trading?
On-Balance Volume (OBV) and VWAP are popular for confirmation and real-time analysis.
❓ Can I trade only using volume?
No. Use volume to support price action, not replace it.
❓ How do I identify a volume spike?
Look for volume that’s 2–3 times higher than the average of previous candles
❓ Does volume work for all timeframes?
Yes. Volume analysis works on daily, weekly, intraday, and even hourly charts.
Top 7 Technical Indicators for Swing Trading You Must Know [2025 Guide]
