
📉 Why is Support and Resistance Important in Technical Analysis? [Complete Beginner’s Guide]
If you’ve ever wondered where to enter or exit a trade confidently, the answer lies in two simple yet powerful concepts: support and resistance. Whether you’re a complete beginner or someone refining your strategy, understanding these levels is non-negotiable in technical analysis. In this guide, you’ll learn why support and resistance are, how to identify them, what they matter, and how to use them with real-world charts. We’ll also include a step-by-step guide, examples, a practical table, pros and cons, and essential tools—so you can make smarter and safer trading decisions.
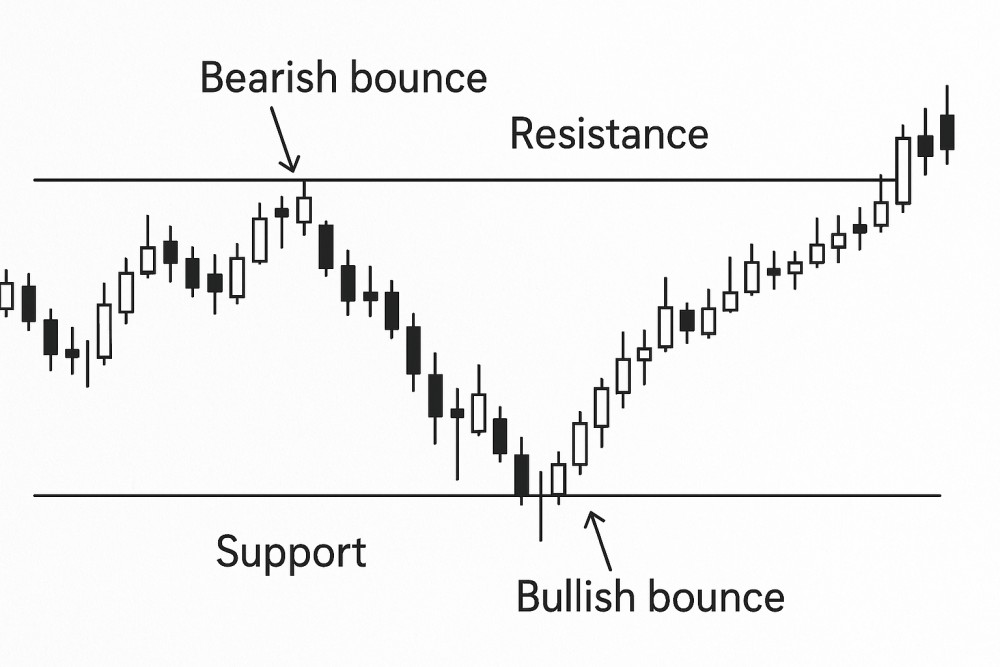
🔍 What are Support and Resistance?
- Support: A price level where buying interest is strong enough to prevent the price from falling further.
- Resistance: A price level where selling pressure prevents the price from rising higher.
Think of support as the floor and resistance as the ceiling of the price movement.
These levels are psychological barriers where the market often pauses or reverses.
Table of Contents
👤 Who Should Use Support and Resistance?
| User Type | Why It’s Important |
| Beginner Traders | Helps plan low-risk entries and exits |
| Swing Traders | Identifies reversal zones |
| Day Traders | Pinpoints breakout and breakdown levels |
| Long-Term Investors | Helps avoid buying at market tops or bottoms |
Whether you trade intraday or invest for years, these levels guide you to smarter decisions.
🧠 Why Support and Resistance Matter in Technical Analysis
Understanding support and resistance helps you:
- Predict price behavior
- Plan entry/exit points
- Place stop-loss and targets smartly
- Avoid emotional decision-making
Example: If Nifty is at 22,000 and the last 3 rallies failed at 22,200, that level is a resistance. A breakout above it signals strength.
📘 Types of Support and Resistance
| Type | Explanation | Example |
| Horizontal (Flat) | Based on past price highs/lows | ₹800 level seen multiple times |
| Trendline Support/Resistance | Sloping line drawn across lows or highs | Upward support line connecting lows |
| Moving Average Based | Dynamic levels using 50/200 EMA | 50-day EMA acts as support |
| Fibonacci Levels | Derived from % retracements (e.g., 38.2%, 61.8%) | Price bouncing near 61.8% retrace |
| Psychological Levels | Round numbers (e.g., 1000, 20000) | Resistance near Nifty 20,000 |
🛠️ Step-by-Step Guide: How to Use Support & Resistance in Trading
✅ Step 1: Identify Key Levels
Use a daily/weekly chart. Look for:
- Multiple touches (2 or more)
- Price rejection with long wicks
- Reversal patterns near those points
✅ Step 2: Confirm the Strength of the Level
- The more times a level is tested without breaking, the stronger it becomes.
- Strong volume at support/resistance confirms it further.
Example: If Reliance tests ₹2400 five times and bounces every time—it’s a powerful support.
✅ Step 3: Plan Your Entry and Exit
- Buy near support, place stop-loss just below
- Sell near resistance, place stop-loss just above
- Breakout Entry: Enter only when price breaks resistance with strong volume
✅ Step 4: Combine with Indicators
Support and resistance become more powerful when combined with:
- RSI (shows overbought/oversold near levels)
- MACD (momentum confirmation)
- Volume (validates breakout or reversal)
⚖️ Pros and Cons of Using Support and Resistance
| Pros | Cons |
| Helps reduce risk with defined stop-loss and targets | Levels are not always accurate or fixed |
| Works on all timeframes and markets | Can be broken by news events or sudden market sentiment |
| Easy to learn and apply | Needs practice to identify the strongest levels |
| Ideal for combining with any technical strategy | Too many levels may confuse new traders |
📊 Example: Nifty Support & Resistance Scenario
Let’s say Nifty has:
- Support: 21,700
- Resistance: 22,400
Scenario 1: Nifty drops to 21,700 and shows bullish candles = Buy opportunity
Scenario 2: Breaks above 22,400 with volume = Confirmed breakout = Buy on retest
Scenario 3: Fails at 22,400 again = Exit or short-sell
This shows how the same levels guide both entry and exit decisions.
✅ Conclusion: Why Support and Resistance Must Be in Your Trading Toolkit
Support and resistance are the foundation of technical analysis. They offer you a structured, rule-based approach to trading or investing—taking you from emotional guesswork to logical decision-making. Whether you’re identifying breakouts, planning entries, or managing risk, these levels serve as your roadmap.
🎯 Mastering support and resistance gives you an edge that even advanced traders rely on every day.
🙋 Frequently Asked Questions (FAQs)
❓ How do I find the most accurate support and resistance levels?
Use a combination of daily charts, past swing highs/lows, and volume zones. Look for multiple price reactions at the same level.
❓ Are support and resistance levels guaranteed to hold?
No. They are zones, not exact prices. Always use a stop-loss.
❓ Can I use support and resistance in all timeframes?
Yes. Day traders use 5-minute/15-minute charts, while long-term investors prefer daily or weekly charts.
❓ Is support/resistance better than indicators?
They’re not competitors. Support and resistance work best when combined with indicators like RSI or MACD.
❓ Can beginners learn this quickly?
Yes. With a little practice, identifying key levels becomes second nature.
Top 7 Technical Indicators for Swing Trading You Must Know [2025 Guide]